

Global NDT in Aerospace & Defense Market Size, Share & Trend Analysis- By Technology Type, By Product Type, By Aircraft Type, By Component Type, By End-User, By Material Type, By Application, By Service Type, By Regulatory Compliance, By Technology Adoption, By Testing Environment – Regional Outlook, Competitive Tactics, and Segment Forecast to 2031.
The worldwide market for NDT in Aerospace & Defense is anticipated to exhibit a compounded annual growth rate (CAGR) of 7.06% during the period spanning from 2023 to 2031. Notably, the market’s valuation in 2021 stood at USD 1913.90 million, and this valuation is poised to ascend significantly to reach USD 3686.96 million by the concluding year of the aforementioned period.
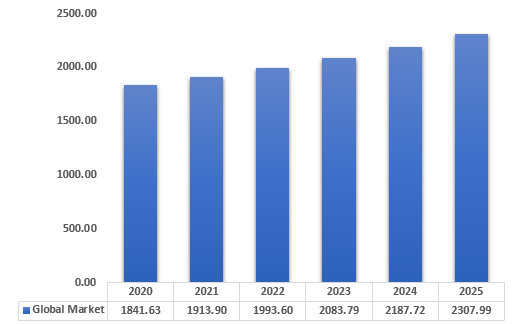
GLOBAL NDT IN AEROSPACE & DEFENSE MARKET SIZE, (2020-2025), (USD MILLION)
Source: Primary Research, Secondary Research, White Paper, Others Publications, Company Website
In the period spanning from 2020 to 2025, the global market size for NDT in Aerospace & Defense demonstrated a consistent upward trajectory, as illustrated in above. Commencing at $ 1841.63 million in 2020, the market experienced successive growth, reaching $ 2307.99 million by 2025.
The trajectory of growth is expected to continue from 2026 to 2031, as depicted in above. Forecasts indicate a steady expansion in the global market for NDT in Aerospace & Defense, with values progressing from $2447.42 million in 2026 to an estimated $3526.44 million in 2031. This extrapolated growth signifies a Compound Annual Growth Rate (CAGR) of 7.06% during the period from 2023 to 2031.
The global market for NDT in Aerospace & Defense is a dynamic landscape, witnessing robust growth across By Technology Type, By Product Type, By Aircraft Type, By Component Type, By End-User, By Material Type, By Application, By Service Type, By Regulatory Compliance, By Technology Adoption, By Testing Environment.
By Technology Type
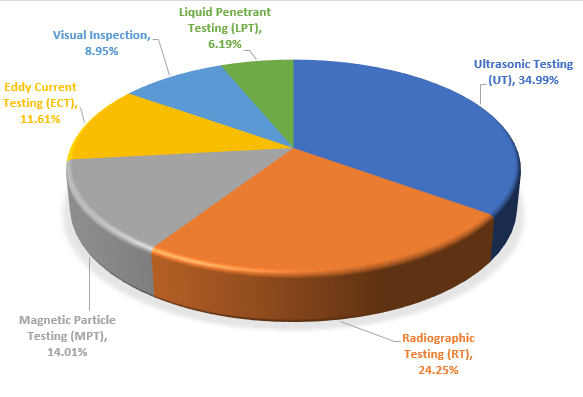
The Non-Destructive Testing (NDT) landscape in the Aerospace & Defense market exhibits a promising trajectory, with various technologies contributing to the industry’s commitment to ensuring the integrity of critical components. Ultrasonic Testing (UT) leads the pack, with a notable revenue increase from $641.40 million in 2020 to $1284.35 million in 2031, supported by a robust CAGR of 7.47%. This growth underscores the growing reliance on UT for high-precision inspections, reflecting its efficacy in detecting flaws and abnormalities in aerospace materials.
Radiographic Testing (RT), capturing internal structures through imaging, demonstrates steady growth, moving from $450.44 million in 2020 to $784.20 million in 2031, with a CAGR of 6.14%. The sustained demand for RT likely stems from its effectiveness in inspecting intricate aerospace components where internal integrity is paramount.
Magnetic Particle Testing (MPT), specializing in surface and near-surface flaw detection, experiences robust growth, increasing from $257.22 million in 2020 to $511.27 million in 2031, boasting a CAGR of 7.42%. This surge in revenue highlights the aerospace industry’s emphasis on reliable surface inspection methods.
Eddy Current Testing (ECT), known for inspecting conductive materials, sees substantial growth, moving from $214.88 million in 2020 to $389.99 million in 2031, with a CAGR of 6.54%. The sustained adoption of ECT suggests its critical role in inspecting crucial aerospace components.
Visual Inspection, a fundamental NDT method, demonstrates strong growth, with revenues climbing from $163.63 million in 2020 to $341.57 million in 2031, supported by a high CAGR of 7.90%. The aerospace industry’s commitment to visual scrutiny for quality assurance is reflected in this robust growth.
Liquid Penetrant Testing (LPT), focusing on surface discontinuities, experiences moderate growth, moving from $114.07 million in 2020 to $215.06 million in 2031, with a CAGR of 6.91%. While slightly slower than some other methods, LPT continues to contribute to the comprehensive NDT solutions adopted in the aerospace sector.
Global NDT in Aerospace & Defense Market Share, (2021), by Technology Type
Source: Primary Research, Secondary Research, White Paper, Others Publications, Company Website
By Product Type
The revenue projections for Non-Destructive Testing (NDT) in the Aerospace & Defense market, segmented by product type, reveal insights into the industry’s dynamics and preferences.
The category of Instruments and Equipment in NDT experiences steady growth, climbing from $854.58 million in 2020 to $1570.94 million in 2031, with a Compound Annual Growth Rate (CAGR) of 6.64%. This consistent upward trend reflects the increasing demand for advanced and sophisticated NDT instruments and equipment in the aerospace and defense sector. The industry’s commitment to precision and reliability drives investments in cutting-edge technologies, contributing to the sustained growth of this product segment.
The Services segment exhibits robust growth, with revenues escalating from $672.86 million in 2020 to $1399.70 million in 2031, showcasing an impressive CAGR of 7.87%. This surge in revenue indicates a growing reliance on outsourcing NDT services in the Aerospace & Defense market. Companies are likely leveraging specialized expertise to conduct inspections, evaluations, and testing, reflecting a strategic shift towards focusing on core competencies while ensuring compliance with stringent quality standards.
The Consumables category, encompassing various testing agents and materials, follows a trajectory of moderate growth. Starting at $314.19 million in 2020, the revenue for Consumables rises to $555.80 million in 2031, with a CAGR of 6.29%. This growth suggests a steady demand for consumable NDT materials in the aerospace and defense sector, where the need for reliable and efficient testing agents remains constant. The increase in revenue is indicative of ongoing investments in consumable resources to support comprehensive NDT processes.
Global NDT in Aerospace & Defense Market Share, (2021), by Product Type
Source: Primary Research, Secondary Research, White Paper, Others Publications, Company Website
By Aircraft Type
The revenue projections for Non-Destructive Testing (NDT) in the Aerospace & Defense market, categorized by aircraft type, offer valuable insights into the evolving demands within the industry.
Revenue generated from NDT in Commercial Aircraft exhibits a consistent upward trend, increasing from $760.50 million in 2020 to $1417.39 million in 2031, with a Compound Annual Growth Rate (CAGR) of 6.79%. This growth signifies the aerospace industry’s sustained commitment to ensuring the safety and reliability of commercial aviation. As commercial aircraft incorporate advanced materials and technologies, the demand for comprehensive NDT solutions continues to rise, contributing to the steady revenue increase over the forecast period.
The Military Aircraft segment experiences robust growth, with revenues climbing from $556.60 million in 2020 to $1130.53 million in 2031, showcasing an impressive CAGR of 7.63%. The military sector’s emphasis on precision and reliability in aerospace applications is reflected in this substantial growth. The increasing complexity of military aircraft components, coupled with stringent safety standards, drives the elevated demand for advanced NDT technologies to ensure mission-critical systems are in optimal condition.
The General Aviation Aircraft category demonstrates steady growth, moving from $228.25 million in 2020 to $448.99 million in 2031, with a CAGR of 7.32%. The general aviation sector’s adoption of NDT solutions is driven by the need to maintain the safety and efficiency of smaller aircraft. As general aviation continues to play a vital role in various applications, including business and personal travel, the demand for reliable NDT practices remains constant, contributing to the positive revenue trajectory.
Revenue from NDT in Helicopters follows a growth path, increasing from $175.73 million in 2020 to $319.89 million in 2031, with a CAGR of 6.57%. Helicopters, serving diverse roles from military operations to emergency medical services, require thorough inspection and testing. The growth in revenue for this segment reflects the aerospace industry’s recognition of the unique NDT needs associated with helicopter components.
The Drones/UAVs category demonstrates steady growth, moving from $120.55 million in 2020 to $209.64 million in 2031, with a CAGR of 6.13%. The rising prominence of unmanned aerial vehicles in various applications, including surveillance, agriculture, and delivery services, contributes to the demand for NDT solutions. Ensuring the structural integrity and reliability of these technologically advanced platforms is crucial, driving the consistent growth observed in this segment.
By Component Type
The revenue breakdown for Non-Destructive Testing (NDT) in the Aerospace & Defense market, segmented by component type, offers a comprehensive view of the industry’s priorities and challenges.
The Airframe component type experiences robust growth, with revenue climbing from $887.67 million in 2020 to $1712.71 million in 2031, boasting a CAGR of 7.13%. This substantial increase underscores the aerospace industry’s emphasis on ensuring the structural integrity and safety of airframes. As aircraft designs become more sophisticated and materials evolve, the demand for advanced NDT solutions for comprehensive airframe inspections contributes significantly to this growth.
The Engine component type shows steady growth, moving from $586.09 million in 2020 to $1091.88 million in 2031, with a CAGR of 6.79%. The propulsion system is a critical element in any aircraft, and as engines become more complex and technologically advanced, the need for precise and thorough NDT inspections rises. This growth in revenue reflects the ongoing investments in NDT technologies to ensure the reliability and performance of aircraft engines.
Revenue from NDT in Landing Gear follows a trajectory of consistent growth, increasing from $233.04 million in 2020 to $458.44 million in 2031, with a CAGR of 7.32%. The landing gear is a crucial component for the safe operation of an aircraft during take-off and landing. The upward revenue trend suggests a heightened focus on NDT inspections to maintain the integrity of landing gear components, reflecting the industry’s commitment to safety and reliability.
The Avionics component type exhibits steady growth, moving from $134.83 million in 2020 to $263.41 million in 2031, with a CAGR of 7.25%. Avionics, encompassing electronic systems used in aircraft, plays a vital role in navigation, communication, and overall aircraft performance. The rising revenue reflects the aerospace industry’s recognition of the importance of NDT in ensuring the functionality and reliability of avionic systems.
By End User
The revenue breakdown for Non-Destructive Testing (NDT) in the Aerospace & Defense market, segmented by end user, reveals distinct trends and priorities within the industry.
Revenue from NDT for Original Equipment Manufacturers (OEMs) shows consistent growth, increasing from $1164.52 million in 2020 to $2156.91 million in 2031, with a Compound Annual Growth Rate (CAGR) of 6.73%. This growth underscores the emphasis on quality assurance during the manufacturing phase. As OEMs strive for innovation and efficiency in aerospace and defense production, the adoption of advanced NDT technologies becomes integral to ensuring the reliability and safety of components from the outset.
MRO organizations exhibit robust growth, with revenues climbing from $677.11 million in 2020 to $1369.52 million in 2031, boasting an impressive CAGR of 7.59%. The maintenance, repair, and overhaul phase is critical for ensuring the continued airworthiness of aircraft throughout their operational life. The upward revenue trend reflects the increasing reliance on NDT solutions during MRO activities to identify and address potential issues, extending the lifespan of aerospace components and enhancing overall safety.
By Material Type
The revenue breakdown for Non-Destructive Testing (NDT) in the Aerospace & Defense market, categorized by material type, offers insights into the industry’s focus on ensuring the integrity and reliability of diverse materials.
Revenue from NDT for Metal Alloys demonstrates robust growth, increasing from $1311.25 million in 2020 to $2528.50 million in 2031, boasting a CAGR of 7.13%. Metal alloys, commonly used in aerospace manufacturing, undergo rigorous inspections to detect any flaws or inconsistencies. The substantial growth in revenue for metal alloys underscores the aerospace and defense industry’s commitment to maintaining the highest quality and safety standards for components made from these materials.
The Composites category experiences steady growth, moving from $350.36 million in 2020 to $663.61 million in 2031, with a CAGR of 6.95%. Composites, including materials like carbon fiber reinforced polymers, are increasingly used in aerospace structures due to their lightweight and high-strength properties. The growth in revenue for composites reflects the industry’s recognition of the unique inspection challenges posed by these materials and the importance of advanced NDT techniques for their thorough examination.
Revenue from NDT for Non-Metallic Materials follows a trajectory of consistent growth, increasing from $180.02 million in 2020 to $334.33 million in 2031, with a CAGR of 6.76%. Non-metallic materials, which include a variety of polymers and ceramics, are integral to modern aerospace designs. The upward revenue trend indicates a heightened focus on NDT solutions tailored for the unique characteristics of non-metallic materials, emphasizing the industry’s commitment to ensuring the safety and reliability of these components.
By Application
The revenue breakdown for Non-Destructive Testing (NDT) in the Aerospace & Defense market, segmented by application, sheds light on the specific areas where NDT plays a crucial role in ensuring the reliability and safety of aerospace components.
Revenue from NDT for Weld Inspection demonstrates robust growth, increasing from $588.33 million in 2020 to $1147.95 million in 2031, boasting a CAGR of 7.23%. Welded joints are critical points in aerospace structures, and the substantial growth in revenue for weld inspection emphasizes the industry’s commitment to detecting and addressing any imperfections in welds. This growth reflects the increasing complexity of aerospace structures and the need for high-precision NDT methods.
Structural Inspection revenues show steady growth, moving from $484.55 million in 2020 to $862.25 million in 2031, with a CAGR of 6.35%. The continuous increase in revenue underscores the industry’s focus on the overall structural integrity of aerospace components. Structural inspections cover a broad range of components, including airframes and load-bearing structures, emphasizing the importance of comprehensive NDT practices to ensure long-term reliability.
Revenue from NDT for Engine Component Inspection follows a trajectory of consistent growth, increasing from $328.53 million in 2020 to $647.10 million in 2031, with a CAGR of 7.33%. Engine components, being critical for the performance and safety of aircraft, undergo rigorous inspection processes. The upward revenue trend reflects the industry’s commitment to deploying advanced NDT techniques to detect any flaws or abnormalities in engine components, ensuring optimal performance and reliability.
Surface Inspection revenues exhibit steady growth, moving from $245.30 million in 2020 to $500.91 million in 2031, with a CAGR of 7.69%. The focus on surface inspection highlights the industry’s emphasis on detecting and addressing defects on the external surfaces of aerospace components. This includes visual inspections and other NDT methods to ensure the integrity and longevity of surfaces exposed to various environmental conditions.
Corrosion Detection revenues show consistent growth, increasing from $194.92 million in 2020 to $368.22 million in 2031, with a CAGR of 6.93%. Corrosion poses a significant threat to the structural integrity of aerospace materials, especially in challenging environmental conditions. The rising revenue in corrosion detection underscores the industry’s proactive approach to identifying and mitigating corrosion-related risks through effective NDT methods.
By Service Type
The revenue breakdown for Non-Destructive Testing (NDT) in the Aerospace & Defense market, segmented by service type, highlights the critical role of inspection, testing, training, and consulting services in ensuring the highest standards of safety and reliability across the industry.
Revenue from Inspection and Testing Services shows steady growth, increasing from $1352.51 million in 2020 to $2515.16 million in 2031, with a Compound Annual Growth Rate (CAGR) of 6.77%. Inspection and testing services are foundational to the NDT industry, playing a pivotal role in identifying and assessing potential defects or anomalies in aerospace components. The continuous growth in this segment reflects the industry’s unwavering commitment to thorough examinations, ensuring the reliability and safety of critical components throughout their lifecycle.
Training and Consulting Services exhibit robust growth, with revenues climbing from $489.12 million in 2020 to $1011.28 million in 2031, boasting an impressive CAGR of 7.81%. As the aerospace and defense sector evolves with technological advancements, the demand for specialized knowledge and expertise in NDT practices rises. Training and consulting services are integral to building and maintaining a skilled workforce capable of deploying advanced NDT techniques. The substantial growth in this segment reflects the industry’s recognition of the need for ongoing education and expert guidance to address evolving challenges and maintain the highest quality standards.
By Regulatory Compliance
The revenue breakdown for Non-Destructive Testing (NDT) in the Aerospace & Defense market, categorized by regulatory compliance standards, reveals the industry’s dedication to meeting stringent guidelines set by aviation authorities.
Revenue from NDT in compliance with FAA standards demonstrates robust growth, increasing from $776.83 million in 2020 to $1503.65 million in 2031, with a CAGR of 7.16%. The FAA sets rigorous standards to ensure the safety and airworthiness of civil aircraft in the United States. The substantial growth in revenue for FAA standards reflects the aerospace industry’s commitment to compliance, meeting the highest safety and quality standards enforced by one of the world’s leading aviation authorities.
Revenue from NDT in compliance with EASA standards exhibits steady growth, moving from $578.59 million in 2020 to $1068.06 million in 2031, with a CAGR of 6.70%. EASA sets standards for civil aviation safety in Europe, and the revenue growth in this segment emphasizes the industry’s commitment to meeting European regulatory requirements. As the aerospace sector continues to globalize, compliance with EASA standards becomes crucial for companies operating in or servicing the European market.
Revenue from NDT in compliance with Military Standards (MIL-STD) follows a trajectory of consistent growth, increasing from $486.22 million in 2020 to $954.73 million in 2031, boasting a CAGR of 7.30%. Military standards are essential for defense applications, and the upward revenue trend in this segment underscores the aerospace and defense industry’s commitment to meeting the stringent requirements set by military authorities. The growth reflects the constant need for precise and reliable NDT practices in military applications.
By Technology Adoption
The revenue breakdown for Non-Destructive Testing (NDT) in the Aerospace & Defense market, classified by technology adoption, reflects the industry’s evolving approach toward adopting advanced NDT techniques alongside conventional methods.
Revenue from Conventional NDT shows steady growth, increasing from $1186.68 million in 2020 to $2143.71 million in 2031, with a Compound Annual Growth Rate (CAGR) of 6.48%. Conventional NDT methods, such as ultrasonic testing, radiographic testing, and liquid penetrant testing, have long been staples in aerospace inspection. The gradual growth in revenue for conventional NDT signifies their continued relevance and effectiveness in identifying defects and ensuring the structural integrity of aerospace components. While these methods remain fundamental, the relatively lower CAGR indicates a shift towards incorporating more advanced techniques.
Revenue from Advanced NDT exhibits significant growth, moving from $654.95 million in 2020 to $1382.72 million in 2031, boasting an impressive CAGR of 8.01%. Advanced NDT technologies, including eddy current testing, phased array ultrasonics, and digital radiography, represent a paradigm shift in the industry. The substantial growth in revenue for advanced NDT reflects the aerospace and defense sector’s increasing adoption of cutting-edge technologies to enhance inspection capabilities. The higher CAGR indicates a faster rate of adoption and investment in advanced NDT techniques, driven by the need for greater precision, efficiency, and adaptability to complex aerospace materials and designs.
By Testing Environment
The revenue breakdown for Non-Destructive Testing (NDT) in the Aerospace & Defense market, categorized by testing environment, reveals the industry’s versatile approach in conducting inspections both on-site and off-site (laboratory), adapting to specific needs and challenges.
Revenue from On-site Testing shows consistent growth, increasing from $1126.61 million in 2020 to $1995.02 million in 2031, with a Compound Annual Growth Rate (CAGR) of 6.27%. On-site testing involves conducting inspections directly at the location of the aerospace and defense components. The steady growth in revenue for on-site testing indicates the industry’s continued reliance on this approach, likely driven by the need for real-time assessments, immediate feedback, and the ability to inspect large and immobile components without the need for transport. The relatively lower CAGR suggests a stable but slower evolution in on-site testing practices compared to laboratory-based methods.
Revenue from Off-site (Laboratory) Testing exhibits significant growth, moving from $715.02 million in 2020 to $1531.42 million in 2031, boasting an impressive CAGR of 8.15%. Laboratory testing involves transporting components to specialized facilities equipped with controlled environments and advanced equipment. The remarkable growth in revenue for off-site testing indicates a shift towards more sophisticated and controlled testing environments. This approach is likely favored for components requiring detailed and precise inspections, where the controlled conditions of a laboratory setting offer advantages in terms of accuracy and repeatability. The higher CAGR suggests a faster rate of adoption and investment in laboratory-based testing methods, possibly driven by advancements in technology and a growing emphasis on precision in aerospace inspections.
Driver, Restraint, Challenge and Opportunities Analysis
Market Driver
The primary driver propelling the growth of Non-Destructive Testing (NDT) in the Aerospace & Defense market is the adherence to stringent regulatory standards and safety compliance. Regulatory bodies such as the Federal Aviation Administration (FAA), the European Union Aviation Safety Agency (EASA), and military standards set forth by organizations like MIL-STD establish rigorous requirements for the inspection and maintenance of aerospace components. These standards mandate comprehensive NDT procedures to ensure the structural integrity, reliability, and airworthiness of aircraft and defense systems. The increasing complexity of aerospace structures, the introduction of new materials, and the imperative for enhanced safety measures drive the demand for advanced NDT techniques. As the industry continues to prioritize compliance with evolving regulations, NDT becomes indispensable in meeting and exceeding these standards, contributing to the overall safety and reliability of aerospace assets.
The growing adoption of advanced materials and technologies within the Aerospace & Defense sector serves as a significant driver for the expansion of NDT. The industry’s continuous pursuit of lightweight, high-performance materials, including composites and alloys, presents unique challenges for inspection and quality assurance. Advanced NDT methods, such as phased array ultrasonic testing, computed tomography, and eddy current array testing, become essential for detecting defects in intricate structures and ensuring the integrity of components made from these advanced materials. Additionally, the integration of innovative technologies in aerospace systems, such as additive manufacturing and 3D printing, necessitates sophisticated NDT solutions to assess the quality and reliability of components produced through these cutting-edge processes. The growing complexity of materials and technologies in the Aerospace & Defense market drives the demand for advanced NDT, positioning it as a critical driver for maintaining and elevating the overall quality standards in the industry.
The Aerospace & Defense industry is witnessing a paradigm shift towards predictive maintenance strategies to enhance operational efficiency and reduce downtime. NDT plays a pivotal role in this shift by providing insights into the structural health of components before potential failures occur. The adoption of advanced NDT technologies facilitates the early detection of defects, degradation, or wear, enabling proactive maintenance interventions. Predictive maintenance not only optimizes aircraft and defense system performance but also significantly reduces operational disruptions and associated costs. As a result, the emphasis on predictive maintenance acts as a key driver for the continued integration and expansion of NDT applications in the Aerospace & Defense market.
The escalating demand for Unmanned Aerial Vehicles (UAVs) and advanced manned aircraft is fostering the growth of NDT in the Aerospace & Defense sector. As the industry experiences a surge in the development and deployment of UAVs for various applications, including surveillance, reconnaissance, and delivery, NDT becomes indispensable for ensuring the structural integrity and reliability of these unmanned platforms. Additionally, the continuous innovation in advanced manned aircraft, such as supersonic and hypersonic planes, introduces new challenges in terms of materials, designs, and operating conditions. Advanced NDT techniques are essential for inspecting and certifying these cutting-edge aircraft, meeting the stringent safety and quality standards. The rising demand for UAVs and advanced aircraft positions NDT as a critical enabler, driving the need for sophisticated inspection methodologies and contributing to the overall growth of the NDT market in the Aerospace & Defense industry.
The global expansion of aerospace manufacturing and Maintenance, Repair, and Overhaul (MRO) activities serves as a significant driver for the NDT market. As aerospace production and MRO activities spread across regions, there is a heightened demand for efficient and standardized NDT solutions to ensure consistent quality across diverse facilities. NDT technologies play a crucial role in facilitating global collaboration by providing standardized inspection and testing methodologies. This driver is particularly relevant as emerging markets contribute to the overall growth of the Aerospace & Defense sector. The need for reliable and standardized NDT practices becomes paramount in supporting the expansion of manufacturing and MRO activities worldwide, driving the adoption of NDT technologies on a global scale.
Market Restraint
Advanced NDT equipment and technologies entail substantial upfront costs.Acquisition and implementation expenses may act as a barrier, especially for smaller aerospace entities.Specialized training requirements contribute to the overall financial burden, limiting accessibility.
Modern aerospace structures often incorporate intricate and composite materials. Conventional NDT methods may struggle to provide precision for these advanced materials. Continuous refinement of advanced NDT techniques is necessary to address the complexity of modern designs.
Market Opportunity
Increasing integration of artificial intelligence (AI) and machine learning (ML) enhances defect detection and analysis. Automation of inspections, predictive analytics, and data-driven decision-making are facilitated. Opportunities arise for the development of smart NDT systems to improve efficiency and accuracy.
Embracing digitization and Industry 4.0 trends in the Aerospace & Defense sector. Smart NDT solutions leverage cloud computing, IoT, and connectivity for real-time monitoring and remote inspections. Opportunities emerge for creating connected and intelligent aerospace ecosystems.
Increasing emphasis on sustainability and environmental responsibility in the aerospace industry. NDT contributes to eco-friendly practices by ensuring the longevity and reliability of aerospace components. Opportunities arise to position NDT as a tool for sustainable aerospace practices, opening new markets and partnerships.
Market Challenges
Evolving regulatory frameworks across regions create complexity for aerospace companies. Harmonization of global standards becomes a challenge to ensure consistent compliance. Collaborative efforts are needed to establish common standards and simplify regulatory adherence.
Rapid advancements in aerospace technologies, such as additive manufacturing and 3D printing, pose challenges for NDT. Ensuring NDT methodologies evolve at a pace matching technological innovations is essential. Collaboration between research institutions, industry experts, and technology developers is crucial to address this challenge.
In conclusion, the Non-Destructive Testing (NDT) market in the Aerospace & Defense sector is poised for significant growth, driven by a convergence of factors such as stringent regulatory standards, the adoption of advanced materials, and a heightened focus on safety and reliability. Despite facing restraints such as high upfront costs and the complexity of modern aerospace structures, the market is evolving to meet these challenges with innovative solutions and continuous advancements in NDT methodologies.
The high upfront costs associated with advanced NDT technologies are being addressed through industry efforts to offer cost-effective solutions and comprehensive training programs. As aerospace companies recognize the critical role of NDT in ensuring compliance with rigorous regulatory standards, the investment in cutting-edge technologies becomes a strategic imperative for long-term operational efficiency and safety.
Challenges related to the diverse regulatory landscape and technological advancements are being met with collaborative initiatives. The harmonization of global standards is underway, facilitated by cooperation between regulatory bodies, industry associations, and NDT solution providers. Moreover, the adaptation of NDT methodologies to match the pace of technological innovations ensures that these techniques remain at the forefront of aerospace inspection capabilities.
Looking ahead, the future scope of the NDT market in the Aerospace & Defense sector is promising, driven by opportunities in areas such as the integration of artificial intelligence (AI) and machine learning (ML). The industry is witnessing a shift toward smart NDT systems that leverage digitization, cloud computing, and the Internet of Things (IoT) for real-time monitoring and predictive analytics. This trend not only enhances the efficiency and accuracy of inspections but also aligns with the broader Industry 4.0 initiatives in the aerospace domain.
Furthermore, sustainability and environmental impact considerations present a new frontier for NDT. As the industry prioritizes eco-friendly practices, NDT’s role in extending the lifecycle of aerospace components contributes to reducing the environmental footprint associated with manufacturing and disposal. Positioning NDT as a tool for sustainable aerospace practices opens avenues for growth and aligns with the industry’s commitment to responsible and environmentally conscious operations.
In conclusion, the NDT market in the Aerospace & Defense sector is evolving to meet emerging challenges and capitalize on opportunities, positioning itself as an indispensable element for ensuring the safety, reliability, and sustainability of aerospace assets. The continuous integration of advanced technologies and collaborative efforts across the industry underscore the resilience and adaptability of NDT in addressing the dynamic needs of the Aerospace & Defense market.
Regional Analysis
The report has been prepared after analysing and reviewing numerous factors that denotes the regional development such as economic, environmental, social, technological, and political inputs of the country. The researchers have closely analysed the data of revenue, production, and manufacturers of each county. These analyses will help the to identify the important areas as potential worth of investment in the upcoming years.
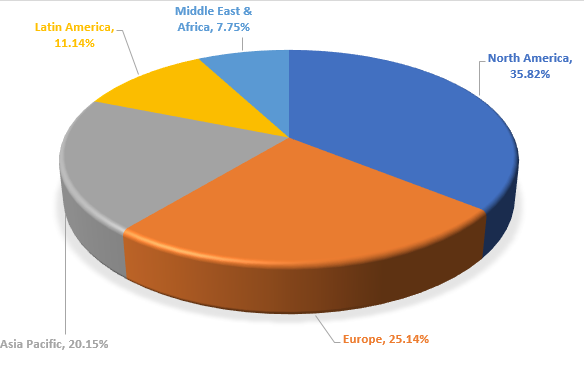
GLOBAL NDT IN AEROSPACE & DEFENSE MARKET SHARE, (2022), BY REGION
Source: Primary Research, Secondary Research, White Paper, Others Publications, Company Website
North America leads in NDT revenue, with consistent growth from $661.72 million in 2020 to $1218.23 million in 2031, resulting in a Compound Annual Growth Rate (CAGR) of 6.65%. This region, home to major aerospace and defense manufacturers, exhibits steady growth. The rise can be attributed to continuous advancements in technology, robust defense spending, and a strong focus on maintaining high-quality standards. The aerospace and defense industry’s presence in North America ensures a consistent demand for NDT services, contributing to the overall growth.
Europe demonstrates substantial growth in NDT revenue, increasing from $461.01 million in 2020 to $925.84 million in 2031, with a notable CAGR of 7.52%. The European aerospace and defense sector’s commitment to innovation, stringent safety regulations, and a dynamic manufacturing landscape contribute to this growth. The higher CAGR suggests a faster rate of adoption of NDT technologies, possibly driven by an emphasis on precision and compliance with evolving industry standards.
The Asia Pacific region experiences significant growth in NDT revenue, moving from $367.95 million in 2020 to $775.38 million in 2031, with a robust CAGR of 7.99%. This remarkable growth can be attributed to the rapid expansion of the aerospace and defense industries in countries like China, India, and Japan. Increasing investments in research, development, and manufacturing capabilities contribute to the surge in demand for NDT services. The higher CAGR indicates a region at the forefront of adopting advanced NDT technologies to support its growing aerospace sector.
Latin America shows steady growth in NDT revenue, increasing from $206.85 million in 2020 to $360.58 million in 2031, with a CAGR of 6.15%. While the growth rate is lower compared to other regions, Latin America’s aerospace and defense industry is gradually embracing NDT services to meet rising safety and quality standards. Economic and industrial development in the region contribute to the increased demand for NDT applications in aerospace.
The Middle East & Africa region experiences modest growth in NDT revenue, moving from $144.11 million in 2020 to $246.41 million in 2031, with a CAGR of 5.96%. The region’s growth is influenced by a mix of defense spending, infrastructure development, and an emerging aerospace sector. The lower CAGR suggests a more gradual adoption of NDT technologies in comparison to other regions.
Competitive Landscape
This section of the report identifies various key manufacturers of the market. It helps the reader understand the strategies and collaborations that players are focusing on combat competition in the market. The reader can will get an updated information on their revenue of manufacturers, product portfolio, recent development and expansion plans during the forecast period
Major players operating in the Global NDT in Aerospace & Defense market are:
In conclusion, Non-Destructive Testing (NDT) is indispensable in the Aerospace & Defense market, playing a pivotal role in ensuring the integrity, safety, and reliability of critical components. The market has experienced steady growth, propelled by stringent regulatory standards, the proliferation of advanced materials, and the industry’s commitment to adopting cutting-edge technologies. As aerospace structures become more intricate, NDT methodologies continue to evolve, addressing challenges and providing solutions for the diverse and complex inspection requirements of modern aerospace systems.
NDT’s significance in compliance with global regulatory standards, such as those set by the Federal Aviation Administration (FAA) and the European Union Aviation Safety Agency (EASA), positions it as a cornerstone in the industry’s commitment to maintaining the highest safety and quality standards. The market has responded to challenges like high upfront costs and complex aerospace structures by fostering innovation and collaborative efforts, leading to the development of cost-effective solutions and advanced NDT techniques capable of handling intricate materials.
Looking ahead, several trends are poised to shape the future of NDT in the Aerospace & Defense market. The integration of artificial intelligence (AI) and machine learning (ML) into NDT processes is a notable trend, enhancing the speed and accuracy of defect detection. Automation and predictive analytics driven by AI and ML technologies are streamlining inspection processes, reducing human intervention, and improving overall efficiency.
Another trend is the increasing emphasis on digitization and Industry 4.0 initiatives. Smart NDT systems leveraging cloud computing, Internet of Things (IoT), and connectivity solutions are emerging. These systems enable real-time monitoring, remote inspections, and centralized data management, aligning with the broader digital transformation goals of the aerospace industry. This trend not only enhances the efficiency of inspections but also contributes to data-driven decision-making and predictive maintenance strategies.
Sustainability and environmental consciousness are driving a trend towards eco-friendly practices in the Aerospace & Defense industry. NDT’s role in extending the lifecycle of aerospace components aligns with these sustainability goals. As the industry places a greater focus on responsible practices, NDT is expected to play a crucial role in minimizing environmental impacts associated with manufacturing and disposal.
In conclusion, the future of NDT in the Aerospace & Defense market is characterized by a dynamic interplay of technology integration, industry collaboration, and a commitment to sustainability. As aerospace systems continue to advance, NDT will remain at the forefront of ensuring the continued airworthiness and reliability of critical components, contributing to the overall safety and success of the aerospace sector.
About Us:
Market Research Corridor is a global market research and management consulting firm serving businesses, non-profits, universities and government agencies. Our goal is to work with organizations to achieve continuous strategic improvement and achieve growth goals. Our industry research reports are designed to provide quantifiable information combined with key industry insights. We aim to provide our clients with the data they need to ensure sustainable organizational development.
Contact Us:
Avinash Jain
Market Research Corridor
Phone: +1 518 250 6491
Email: [email protected]
Chapter 2. Research Methodology
2.1. Secondary Research
2.2. Primary Research
2.3. Secondary Analyst Tools and Models
Chapter 3. Market Dynamics
3.1. Market driver analysis
3.2. Market restraint analysis
3.3. Market Opportunity
3.4. Market Challenges
3.5. Impact analysis of COVID-19 on the NDT in Aerospace & Defense market
Chapter 4. Market Variables and Outlook
4.1. SWOT Analysis
4.1.1. Strengths
4.1.2. Weaknesses
4.1.3. Opportunities
4.1.4. Threats
4.2. Supply Chain Analysis
4.3. PESTEL Analysis
4.3.1. Political Landscape
4.3.2. Economic Landscape
4.3.3. Social Landscape
4.3.4. Technological Landscape
4.3.5. Environmental Landscape
4.3.6. Legal Landscape
4.4. Porter’s Five Forces Analysis
4.4.1. Bargaining Power of Suppliers
4.4.2. Bargaining Power of Buyers
4.4.3. Threat of Substitute
4.4.4. Threat of New Entrant
4.4.5. Competitive Rivalry
Chapter 5. NDT in Aerospace & Defense Market: By Technology Type Estimates & Trend Analysis
5.1. NDT in Aerospace & Defense Market value share and forecast, (2020 to 2031) (USD Million)
5.2. Incremental Growth Analysis and Infographic Presentation
5.2.1. Ultrasonic Testing (UT)
5.2.1.1. Market Size & Forecast, 2020-2031
5.2.2. Radiographic Testing (RT)
5.2.2.1. Market Size & Forecast, 2020-2031
5.2.3. Magnetic Particle Testing (MPT)
5.2.3.1. Market Size & Forecast, 2020-2031
5.2.4. Eddy Current Testing (ECT)
5.2.4.1. Market Size & Forecast, 2020-2031
5.2.5. Visual Inspection
5.2.5.1. Market Size & Forecast, 2020-2031
5.2.6. Liquid Penetrant Testing (LPT)
5.2.6.1. Market Size & Forecast, 2020-2031
Chapter 6. NDT in Aerospace & Defense Market: By Product Type Estimates & Trend Analysis
6.1. NDT in Aerospace & Defense Market value share and forecast, (2020 to 2031) (USD Million)
6.2. Incremental Growth Analysis and Infographic Presentation
6.2.1. Instruments and Equipment
6.2.1.1. Market Size & Forecast, 2020-2031
6.2.2. Services
6.2.2.1. Market Size & Forecast, 2020-2031
6.2.3. Consumables
6.2.3.1. Market Size & Forecast, 2020-2031
Chapter 7. NDT in Aerospace & Defense Market: By Aircraft Type Estimates & Trend Analysis
7.1. NDT in Aerospace & Defense Market value share and forecast, (2020 to 2031) (USD Million)
7.2. Incremental Growth Analysis and Infographic Presentation
7.2.1. Commercial Aircraft
7.2.1.1. Market Size & Forecast, 2020-2031
7.2.2. Military Aircraft
7.2.2.1. Market Size & Forecast, 2020-2031
7.2.3. General Aviation Aircraft
7.2.3.1. Market Size & Forecast, 2020-2031
7.2.4. Helicopters
7.2.4.1. Market Size & Forecast, 2020-2031
7.2.5. Drones/UAVs
7.2.5.1. Market Size & Forecast, 2020-2031
Chapter 8. NDT in Aerospace & Defense Market: By Component Type Estimates & Trend Analysis
8.1. NDT in Aerospace & Defense Market value share and forecast, (2020 to 2031) (USD Million)
8.2. Incremental Growth Analysis and Infographic Presentation
8.2.1. Airframe
8.2.1.1. Market Size & Forecast, 2020-2031
8.2.2. Engine
8.2.2.1. Market Size & Forecast, 2020-2031
8.2.3. Landing Gear
8.2.3.1. Market Size & Forecast, 2020-2031
8.2.4. Avionics
8.2.4.1. Market Size & Forecast, 2020-2031
Chapter 9. NDT in Aerospace & Defense Market: By End User Estimates & Trend Analysis
9.1. NDT in Aerospace & Defense Market value share and forecast, (2020 to 2031) (USD Million)
9.2. Incremental Growth Analysis and Infographic Presentation
9.2.1. Original Equipment Manufacturers (OEMs)
9.2.1.1. Market Size & Forecast, 2020-2031
9.2.2. Maintenance, Repair, and Overhaul (MRO) Organizations
9.2.2.1. Market Size & Forecast, 2020-2031
Chapter 10. NDT in Aerospace & Defense Market: By Material Type Estimates & Trend Analysis
10.1. NDT in Aerospace & Defense Market value share and forecast, (2020 to 2031) (USD Million)
10.2. Incremental Growth Analysis and Infographic Presentation
10.2.1. Metal Alloys
10.2.1.1. Market Size & Forecast, 2020-2031
10.2.2. Composites
10.2.2.1. Market Size & Forecast, 2020-2031
10.2.3. Non-Metallic Materials
10.2.3.1. Market Size & Forecast, 2020-2031
Chapter 11. NDT in Aerospace & Defense Market: By Application Estimates & Trend Analysis
11.1. NDT in Aerospace & Defense Market value share and forecast, (2020 to 2031) (USD Million)
11.2. Incremental Growth Analysis and Infographic Presentation
11.2.1. Weld Inspection
11.2.1.1. Market Size & Forecast, 2020-2031
11.2.2. Structural Inspection
11.2.2.1. Market Size & Forecast, 2020-2031
11.2.3. Engine Component Inspection
11.2.3.1. Market Size & Forecast, 2020-2031
11.2.4. Surface Inspection
11.2.4.1. Market Size & Forecast, 2020-2031
11.2.5. Corrosion Detection
11.2.5.1. Market Size & Forecast, 2020-2031
Chapter 12. NDT in Aerospace & Defense Market: By Service Type Estimates & Trend Analysis
12.1. NDT in Aerospace & Defense Market value share and forecast, (2020 to 2031) (USD Million)
12.2. Incremental Growth Analysis and Infographic Presentation
12.2.1. Inspection and Testing Services
12.2.1.1. Market Size & Forecast, 2020-2031
12.2.2. Training and Consulting Services
12.2.2.1. Market Size & Forecast, 2020-2031
Chapter 13. NDT in Aerospace & Defense Market: By Regulatory Compliance Estimates & Trend Analysis
13.1. NDT in Aerospace & Defense Market value share and forecast, (2020 to 2031) (USD Million)
13.2. Incremental Growth Analysis and Infographic Presentation
13.2.1. Federal Aviation Administration (FAA) Standards
13.2.1.1. Market Size & Forecast, 2020-2031
13.2.2. European Union Aviation Safety Agency (EASA) Standards
13.2.2.1. Market Size & Forecast, 2020-2031
13.2.3. Military Standards (MIL-STD)
13.2.3.1. Market Size & Forecast, 2020-2031
Chapter 14. NDT in Aerospace & Defense Market: By Technology Adoption Estimates & Trend Analysis
14.1. NDT in Aerospace & Defense Market value share and forecast, (2020 to 2031) (USD Million)
14.2. Incremental Growth Analysis and Infographic Presentation
14.2.1. Conventional NDT
14.2.1.1. Market Size & Forecast, 2020-2031
14.2.2. Advanced NDT
14.2.2.1. Market Size & Forecast, 2020-2031
Chapter 15. NDT in Aerospace & Defense Market: By Testing Environment Estimates & Trend Analysis
15.1. NDT in Aerospace & Defense Market value share and forecast, (2020 to 2031) (USD Million)
15.2. Incremental Growth Analysis and Infographic Presentation
15.2.1. On-site Testing
15.2.1.1. Market Size & Forecast, 2020-2031
15.2.2. Off-site (Laboratory) Testing
15.2.2.1. Market Size & Forecast, 2020-2031
Chapter 16. NDT in Aerospace & Defense Market: Regional Estimates & Trend Analysis
16.1. NDT in Aerospace & Defense Market value share and forecast, (2020 to 2031) (USD Million)
16.2. Incremental Growth Analysis and Infographic Presentation
16.3. North America
16.3.1.1. Market Size & Forecast, 2020-2031
16.4. Europe
16.4.1.1. Market Size & Forecast, 2020-2031
16.5. Asia Pacific
16.5.1.1. Market Size & Forecast, 2020-2031
16.6. Middle East & Africa
16.6.1.1. Market Size & Forecast, 2020-2031
16.7. Latin America
16.7.1.1. Market Size & Forecast, 2020-2031
Chapter 17. NDT in Aerospace & Defense Market: Country Estimates & Trend Analysis
17.1. NDT in Aerospace & Defense Market value share and forecast, (2020 to 2031) (USD Million)
17.2. Incremental Growth Analysis and Infographic Presentation
17.3. U.S.
17.3.1.1. Market Size & Forecast, 2020-2031
17.4. Canada
17.4.1.1. Market Size & Forecast, 2020-2031
17.5. Mexico
17.5.1.1. Market Size & Forecast, 2020-2031
17.6. UK
17.6.1.1. Market Size & Forecast, 2020-2031
17.7. France
17.7.1.1. Market Size & Forecast, 2020-2031
17.8. Germany
17.8.1.1. Market Size & Forecast, 2020-2031
17.9. Russia
17.9.1.1. Market Size & Forecast, 2020-2031
17.10. Italy
17.10.1.1. Market Size & Forecast, 2020-2031
17.11. Spain
17.11.1.1. Market Size & Forecast, 2020-2031
17.12. China
17.12.1.1. Market Size & Forecast, 2020-2031
17.13. India
17.13.1.1. Market Size & Forecast, 2020-2031
17.14. Japan
17.14.1.1. Market Size & Forecast, 2020-2031
17.15. Indonesia
17.15.1.1. Market Size & Forecast, 2020-2031
17.16. South Korea
17.16.1.1. Market Size & Forecast, 2020-2031
17.17. Australia
17.17.1.1. Market Size & Forecast, 2020-2031
17.18. Brazil
17.18.1.1. Market Size & Forecast, 2020-2031
17.19. Argentina
17.19.1.1. Market Size & Forecast, 2020-2031
17.20. Saudi Arabia
17.20.1.1. Market Size & Forecast, 2020-2031
17.21. UAE
17.21.1.1. Market Size & Forecast, 2020-2031
17.22. South Africa
17.22.1.1. Market Size & Forecast, 2020-2031
Chapter 18. Competitive Landscape
18.1. Company Market Share Analysis
18.2. Vendor Landscape
18.3. Competition Dashboard
Chapter 19. Company Profiles
19.1. Business Overview, Product Landscape, Financial Performanceand Company Strategies for below companies
19.1.1. TÜV SÜD AG
19.1.1.1. Company Overview
19.1.1.2. Financial Performance
19.1.1.3. Product Benchmarking
19.1.1.4. Geographic Footprint
19.1.1.5. Strategic Initiatives
19.1.2. SGS SA
19.1.2.1. Company Overview
19.1.2.2. Financial Performance
19.1.2.3. Product Benchmarking
19.1.2.4. Geographic Footprint
19.1.2.5. Strategic Initiatives
19.1.3. GE Aviation
19.1.3.1. Company Overview
19.1.3.2. Financial Performance
19.1.3.3. Product Benchmarking
19.1.3.4. Geographic Footprint
19.1.3.5. Strategic Initiatives
19.1.4. Rolls-Royce plc
19.1.4.1. Company Overview
19.1.4.2. Financial Performance
19.1.4.3. Product Benchmarking
19.1.4.4. Geographic Footprint
19.1.4.5. Strategic Initiatives
19.1.5. Eaton Corporation plc
19.1.5.1. Company Overview
19.1.5.2. Financial Performance
19.1.5.3. Product Benchmarking
19.1.5.4. Geographic Footprint
19.1.5.5. Strategic Initiatives
19.1.6. Zeiss Group
19.1.6.1. Company Overview
19.1.6.2. Financial Performance
19.1.6.3. Product Benchmarking
19.1.6.4. Geographic Footprint
19.1.6.5. Strategic Initiatives
19.1.7. Nikon Corporation
19.1.7.1. Company Overview
19.1.7.2. Financial Performance
19.1.7.3. Product Benchmarking
19.1.7.4. Geographic Footprint
19.1.7.5. Strategic Initiatives
19.1.8. Mistras Group Inc.
19.1.8.1. Company Overview
19.1.8.2. Financial Performance
19.1.8.3. Product Benchmarking
19.1.8.4. Geographic Footprint
19.1.8.5. Strategic Initiatives
19.1.9. Sonatest Inc.
19.1.9.1. Company Overview
19.1.9.2. Financial Performance
19.1.9.3. Product Benchmarking
19.1.9.4. Geographic Footprint
19.1.9.5. Strategic Initiatives
19.1.10. ACNDT Inc.
19.1.10.1. Company Overview
19.1.10.2. Financial Performance
19.1.10.3. Product Benchmarking
19.1.10.4. Geographic Footprint
19.1.10.5. Strategic Initiatives
Chapter 20. Conclusion

Our Executive will walk you through a 15-minute call to present the report’s content and answer all queries if you have any.